
Tool version: OkurraButton — release 2.05
A note on chapter scope. This chapter describes how to operate the OkurraButton panel — where to click what, how to edit, how to save a configuration. The meaning of the individual button parameters (what Threshold does, how Movement Correction works, etc.) is covered in chapter 9. Here you learn the tool; there — the strategy. On a first read it is worth keeping both chapters side by side.
Table of contents
4.1 What OkurraButton is 4.2 The design chart — without the EA 4.3 Panel anatomy 4.4 Selecting the active button (B1–B5) 4.5 The twelve parameter sections 4.6 Editing values — fields, dropdowns, ENTER/ESC 4.7 Draft and applied — what “Apply” means 4.8 The top action row: R, To:, Apply, Save, Load 4.9 Cloning a configuration between buttons (To:) 4.10 Companion indicators and signal visualization 4.11 Layout: horizontal layout, two columns, scale, dragging 4.12 The typical design cycle for one button
4.1 What OkurraButton is
This chapter describes the OkurraButton panel at version 2.16 — the version shipped in release 2.05. The panel’s title bar shows only the name “O!kurraButton”; you can see the version number in the indicator’s properties window (the Common tab) and in chapter 23. The panels carry their own numbers, independent of the release number (chapter 23, “How do I know I have the latest version?”).
OkurraButton is the design panel for the five strategies — a design-mode tool (chapter 2) in which you lay out the parameters of buttons B1…B5, one after another, on a live chart and with instant preview. It is a MetaTrader indicator, dropped onto the chart by dragging it from the Navigator window, like any other.
What OkurraButton is:
- An editor of button configurations. All the parameters of a single strategy — direction, the OKUR engine, triggers, pendings, limits, lot, SL/TP, Break Even, Trailing Stop, local filters, the Activation & Exits section, cross-button triggers — you edit right here on the panel, without going into the EA’s Inputs window.
- A visual tool. Together with the companion indicators (section 4.10) it shows on the chart what a given button sees: the OKUR oscillator trace, the SAR dots, the MMD clouds, the SR zones, and even arrows at the places where, with the current configuration, entry signals would have appeared.
- An exporter to
.set. When the configuration suits you, with a single click you save it to a.setfile, which you load into the EA (chapter 7).
What OkurraButton is not: it does not trade. It does not open positions, does not place orders, does not touch the account. It is exclusively a design tool. It is the EA — running separately, with the .set loaded — that executes what you design here (chapter 2).
4.2 The design chart — without the EA
OkurraButton is designed to work on a separate design chart, without a running EA. This is deliberate and follows directly from the two-mode architecture: you design in one place (the indicators), you execute in another (the EA), and they are connected by the .set file — not a live link (chapter 2.7).
In practice it looks like this:
- You drop OkurraButton onto a clean chart (e.g. a second XAUUSD window), without the EA. The panel works on its own — if a given button does not have a saved state yet, OkurraButton automatically seeds sensible defaults for the active strategy. These are not empty or random fields — they are exactly the same values that the EA carries for that button (among others, B1/B3/B5 start as SELL with a +150 threshold and B2/B4 as BUY with a −150 threshold; OKUR Period 6, SL 200 / TP 400, etc.). So you have a consistent starting point, and a
.setexported from it will not show “empty” buttons in the EA. There is one deliberate exception: the visual previews (Show Oscillator / SAR / MMD / SR Box and the on-chart arrows) start here disabled — that is the “zero state” rule (chapter 6.6): a fresh design chart is supposed to be empty until you turn the previews on yourself. In the EA itself the analogous Show … On Chart switches default to enabled. - If you drop OkurraButton onto a chart where an EA is already running, the panel displays a conflict banner with a message along the lines of “CONFLICT: Okurra EA on this chart — remove OkurraButton (design charts only, no EA)”. It is a reminder that we keep designing and execution on separate charts. The EA has its own control panel (chapter 8); OkurraButton is a design tool and has no business on an execution chart.
The cleanest working arrangement: one window of the instrument with the design panels (OkurraButton + OkurraGlobal + companion indicators), a second window of the same instrument with the running EA. You design in the first, save the .set, load it in the second.
Access to the tool. OkurraButton is free (chapter 3.2) — like all O!kurra indicators, including the companion indicators it pulls onto the chart. It works right after installation, with no key and no activation.
4.3 Panel anatomy
The OkurraButton panel, top to bottom:
- Title bar — the tool’s name, and on the left a small square button collapsing the whole panel (
[-]when expanded,[+]when collapsed). The collapse is remembered separately for each chart, like the collapse of the sections — it survives a timeframe change, a parameter change and a restart; removing the panel from the chart or closing the chart gives an expanded start. On the right of the title bar stands a smallH/Vbutton that switches the panel’s layout (from 2.05, section 4.11). The bar is also the handle for dragging the panel around the chart (section 4.11). - Status bar — a short message about the current state (e.g. “Saved: … (5/5 btns)”, “Reset done (F7 for defaults)”, the Apply confirmation, warnings — section 4.7). It remains visible even after the panel is collapsed.
- Top action row — five buttons: R, To:, Apply, Save, Load (section 4.8).
- The B1–B5 selector row — five buttons for choosing which strategy you are currently designing (section 4.4), and at the end of the row a small
Pbutton opening the presets/history window of the active button (section 4.8). Since release 2.00 the selector tiles are wider (five instead of seven at the same panel width). The row is visible by default; if needed it can be hidden in the indicator settings. - The twelve parameter sections — collapsible blocks grouping the button’s parameters (section 4.5). In the horizontal layout a bar of tabs stands in place of the list of sections (section 4.11).
![a screenshot-mockup of the OkurraButton panel with callouts pointing to: the title bar with [-] on the left and the small H/V button on the right, the status bar, the top action row R/To:/Apply/Save/Load, BELOW it the B1–B5 selector row (B1 highlighted, five wider tiles) with the small P button at the end of the row, and the list of 12 collapsible sections; one section expanded showing example parameter fields](/img/manual/en/ch04_button_panel_overview.svg)
In the vertical layout each section has a header with a collapse button (+/−) — click it to collapse or expand. The collapse state is remembered across chart refreshes and restarts, so you can keep the panel focused only on the sections you are currently working on. Optionally, each section header also has a small “A” button (quick-Apply) — it does the same as the main Apply (section 4.7), just conveniently from the section level (these buttons can be enabled/disabled in the indicator settings).
4.4 Selecting the active button (B1–B5)
OkurraButton edits one button at a time — the currently active one. The selector row (five buttons B1…B5) is for switching between strategies: you click B3 and the panel shows button 3’s parameters; you click B1 and you are back at the first.
- Which button is active at start you set in the indicator options (1 = B1, 2 = B2, …;
0= start “empty”, the panel waits until you click the selector). Default0— a freshly dropped OkurraButton has no button selected and draws nothing (see “Zero state”, chapter 6.6). - Your last choice is remembered — if you switch to B5 and change the timeframe or recompile, the panel comes back to B5, not to the button set at start. Convenient during long work on one strategy.
- Each button has its own independent state. Switching the selector does not mix configurations — B1 and B3 are two separate strategies, each with its own full set of parameters.
The selector shows the direction of the active button with color — the highlighted slot glows green (BUY) or red (SELL). The other slots remain neutral; you see the direction for the button you are currently working on.
4.5 The twelve parameter sections
The button’s parameters are grouped into twelve sections that correspond 1:1 to the parameter groups in the EA’s Inputs window. Thanks to this, what you design in the panel has exactly the same layout as the configuration in the robot.
| # | Section | What it groups (meaning → chapter) |
|---|---|---|
| 1 | Button Identification | label, initial state, direction (ch. 9.2) |
| 2 | OKUR oscillator | the OKUR engine: Period, Sensitivity, Timeframe, Threshold, Active Side, from 2.05 the zone’s far edge (Zone Reach), triggers, the signal validity window (ch. 9.3–9.4) |
| 3 | Position Limits / Size | position limits, the lot and Multisize scaling (ch. 9.8–9.9) |
| 4 | Stop Loss / Take Profit | SL and TP (ch. 9.8) |
| 5 | Break Even / Trailing Stop | position management (ch. 9.9–9.10) |
| 6 | SAR Filter | the local SAR filter (ch. 10) |
| 7 | MMD Clouds Filter | the local MMD filter (ch. 10) |
| 8 | SR Box Filter | the local SR filter (ch. 10) |
| 9 | Global Filters | Global Filters Mode (All/Any, since 1.28 rev 0231) + the opt-in to the global filters (ch. 10) |
| 10 | Activation & Exits | zones, Follow BEa, Stop on Opposite (ch. 9.12, 11–13) |
| 11 | Time Setups | collecting for the time setups of this button’s direction, and Timed Exit (ch. 19) |
| 12 | Triggers | this button’s cross-button triggers (ch. 17) |
In this chapter we are interested in where these parameters are and how to edit them — not what they mean. The full meaning of each is in the chapters listed in the table. Pendings (Pending Stop/Limit Distance) live in the engine/limits sections — details in ch. 9.5.
You can also set the same parameters directly in the EA. Since the panel sections correspond 1:1 to the groups in the EA’s Inputs window, you can enter any value either here — in the panel, with the on-chart preview — or directly in the robot’s Inputs, without the indicators (chapter 2.3). The panel is more convenient (preview, the gold change marker, fewer mistakes); Inputs are always available as the “right now” route. Either way, a single
.setfile is what reaches the EA.
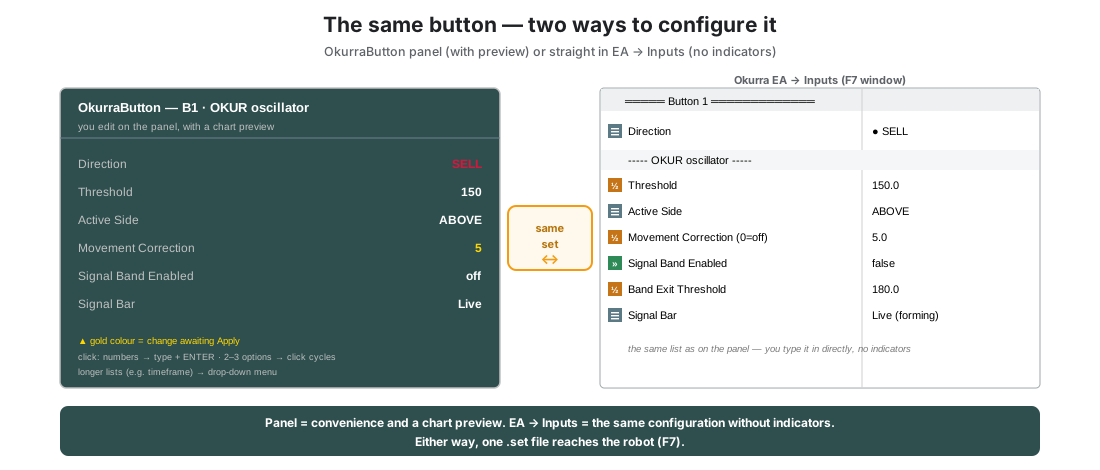
The panel has limited width — you have three ways not to get lost in it. First: collapse sections and keep open only the ones you are working on (working on the OKUR engine you collapse the filters, working on the filters you collapse the engine). Second: enable the two-column panel split (section 4.11) — then some sections land in the left column, the rest in the right, and you see much more at once without scrolling. The first two approaches can be combined. Third (from 2.05): switch the panel to the horizontal layout — the bar of tabs shows one section at a time, full width (section 4.11).
4.6 Editing values — fields, dropdowns, ENTER/ESC
Parameter editing happens right on the panel, without system dialog windows:
- Numeric and text fields (e.g. Threshold, Stop Loss, the label) — you click the value, the field becomes editable (white background). You type the new value and confirm with ENTER. ESC cancels the edit and restores the previous value.
- Choice fields with a small number of options (usually 2–3, e.g. direction BUY/SELL, Active Side ABOVE/BELOW) — successive clicks cycle through the available values (looping). You click until the one you are after appears — fast and without a list. Selected action fields with more options also cycle, where a list would be too narrow to read — among them the Price Movement sensor picker and Extreme Mode (5 values; since Button 1.10, by user request).
- Choice fields with more options (e.g. the timeframe — 7–21 items) — they expand a list from which you pick the value. The contents of the timeframe list can be limited in the indicator options.
- Switches (on/off) — e.g. the filter or Break Even switches — you click to toggle between the on and off states.
In the horizontal layout (section 4.11) the edit field and the choice list open the same way, at the right edge of the row.
Editing on the panel changes the working version of the configuration (the draft) — what you see, but not yet “committed”. Only Apply (section 4.7) moves the working version to the applied state, which the companion indicators read and which you export to .set. The draft/applied distinction is described in the next section.
4.7 Draft and applied — what “Apply” means
This is the panel’s key mechanism and it is worth understanding well, because it explains why merely editing a field “does nothing yet”.
The panel holds each button’s configuration in two layers:
- Draft (working) — your current edits. Every click and value change lands here. The draft is a “scratchpad” — you can change dozens of fields in it before committing anything.
- Applied — the last committed state. This is what the companion indicators read (to draw the right filters) and this is the basis of the export to
.set.
Apply is the act of committing: it moves draft → applied. What exactly happens when you click Apply (in the manual model — chapter 2.7):
- The working version becomes the applied one — saved to the internal state file (
B<N>_applied.ini). - A copy is appended to history (
OKU/history/auto_B<N>_<timestamp>.ini) — from 2.05 the panel keeps the 10 newest auto-copies per button and deletes older ones by itself (chapter 2.6). You can go back to one of the last ten states even without a.set. - The companion indicators refresh — the SAR dots, the MMD clouds etc. redraw under the new configuration.
What Apply does not do: it sends nothing to the EA. This is the manual model (chapter 2.7) — for the designed configuration to reach the robot, you must save it to a .set (the Save button, section 4.8) and load it in the EA via F7. Apply is “committing the design”, not “launching it in the robot”.
What the status bar says after Apply (from 2.05). After a successful Apply the status bar shows a confirmation for 5 seconds (B1 applied locally … for button B1). When the panel sees a setting the robot will not accept, it shows a red warning that fits in the panel for 10 seconds, e.g. “B1: Zone Reach wrong side - ignored”, “B1: Band Exit wrong side - band off” or “B1: Continuation > zone width”; with several at once — “B1: N warnings - see Experts log”, and the details are in the Experts log. The meaning of these settings — chapter 9.4–9.6.
Gold color = an uncommitted change. A field you changed but have not committed yet (it differs from the applied state) is highlighted gold. It is a visual sign that something in the draft is waiting for Apply. After clicking Apply the highlight disappears — the value becomes the new applied state. With a single glance you can therefore see whether and where you have unsaved changes.
A practical consequence. If you change a field and do not click Apply, the companion indicators keep showing the old state — because they read from applied, not from draft (and the field itself glows gold, reminding you of the uncommitted change). You will see the effect of the change on the chart only after Apply. That is the natural rhythm: edit a few fields → Apply → look at the chart → fix → Apply → ….
4.8 The top action row: R, To:, Apply, Save, Load
The five buttons in the panel’s top row (the row can be hidden in the indicator settings if needed):
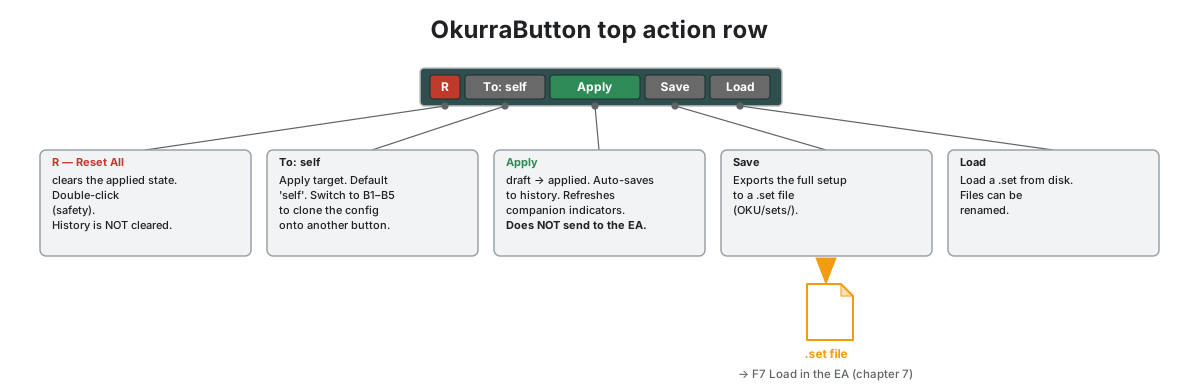
R — Reset All. Clears the applied state of the buttons (returns the panel to a blank slate). It is a destructive action, so it is protected with a double click: the first click “arms” it (the button turns bright red for a few seconds), the second click within that time window performs the reset. Reset clears the applied state and the panel’s memory, but does not delete the history (OKU/history/) — the earlier auto-saves remain, so you can recover a configuration if you reset by mistake.
To: — the Apply target. Switches which button the Apply click lands on. By default “To: self” — Apply commits the active button onto itself. You can, however, point at another slot (B1…B5) to clone the current configuration onto another button (section 4.9).
Apply — commit. Moves draft → applied for the indicated target (section 4.7).
Save — save a .set. Exports all five buttons (B1…B5) to a .set file in OKU/sets/ (the full set of strategies; without the global section — that one you save from OkurraGlobal). After clicking Save a small save dialog opens in which you name the file right away (confirm with “V”, cancel with “X”) — so you can enter a readable name during the save itself, e.g. XAUUSD_scalp_M1. (The name can also be changed later, in the Load dialog.) From OkurraButton the parameters of all five buttons (B1…B5) are saved; if you want the full configuration including the global section, you save the .set from OkurraGlobal (chapters 2.4 and 7).
Load — load a .set. Opens a browser of the .set files in OKU/sets/. You pick a file and the panel loads the button configuration from it. In the Load dialog you can also rename the saved files (e.g. change Button_<timestamp>.set to XAUUSD_scalp_M1.set). If OkurraGlobal is also on the chart, loading a .set in OkurraButton will synchronize its global section too (cross-sync, chapter 2.5).
One more button completes the set — formally not in the action row, but at the end of the B1–B5 selector row (geometrically right under Load):
P — presets and history of the active button. Opens a window with the list of saves of the active button from the history folder (OKU/history/, chapter 7.5): auto-saves from every Apply (auto_B<N>_...), manually named presets (manual_B<N>_...) and pending offline edits (offline_B<N>_...). Clicking a row loads the save into the working version of the active button (the draft — then Apply to commit). A row can also be renamed — giving it your own label turns the save into a manual_B<N>_<label> preset — or deleted (deletion protected by a second click, as with R). If no button is selected, the button responds with the message “Click B1..B5 first to choose a slot”. This is different from Load: Load loads full .set files from OKU/sets/, while P browses the history of a single button.
In the horizontal layout the Save, Load and P windows cover the bar of tabs just as they cover the sections; after the window closes, the panel returns to the selected tab.
4.9 Cloning a configuration between buttons (To:)
The To: button turns Apply into a strategy-copying tool. A typical scenario: you designed a well-performing BUY button on B1 and want a SELL variant on B2, or a second BUY track on B3 with a small change.
The sequence:
- Select the source button in the selector (e.g. B1) and make sure its configuration is the one you want to duplicate.
- Click To: and switch the target to the destination slot (e.g. “To: B3”).
- Click Apply — the current working configuration is committed onto button B3.
- Switch the selector to B3 and fine-tune the differences (e.g. change the Threshold, direction, timeframe).
This is much faster than retyping dozens of fields by hand. Just remember to switch the selector to the target after cloning and check the result — especially the direction, if you are making an opposite variant.
After Apply the target returns to “self” by itself. There is no “forgotten target” trap: every Apply with To: B<n> set performs the clone and immediately resets the button to “To: self” — the next Apply commits the active button again. Want to clone onto several slots — set To: before each Apply.
4.10 Companion indicators and signal visualization
OkurraButton itself only draws the panel; the picture of the market through the button’s lens is shown by the companion indicators. OkurraButton can pull them in automatically — the auto-load switches in the indicator settings, active by default, are responsible for that:
- OkurraOscillator — loaded into a separate window below the chart (the OKUR oscillator trace of the active button).
- OkurraMMD, OkurraSAR, OkurraSR — chart overlays: respectively the MMD clouds, the SAR dots and the SR zones of the active button.
- a separate switch makes the pulled-in indicators be removed together with OkurraButton when you take it off the chart (so they do not stay behind as orphans).
The companion indicators show the configuration of the active button (the one in the selector) and refresh after Apply. You switch the selector to B3 → they show B3’s filters and oscillator. That is the essence of “designing while seeing”: you change the Threshold, click Apply, and immediately see on the chart where the oscillator’s active zone now falls. The full description of the companion indicators — chapter 6.
Zero state. Auto-loading only pulls in the indicators — none of them draws anything until you select a button and enable the specific previews for it (Show … On Chart, disabled by default; after Apply). A fresh chart is empty (chapter 6.6).
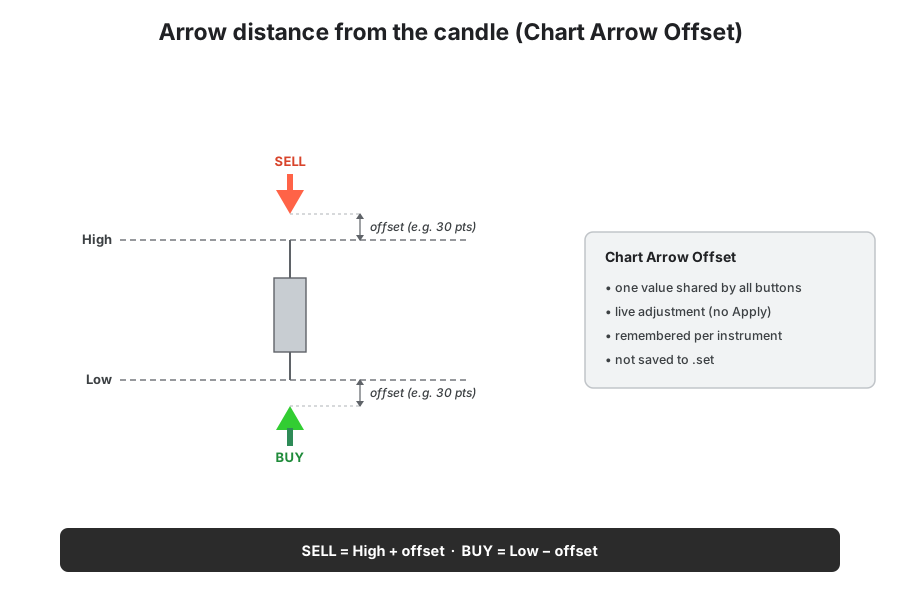
Arrows on the chart (Show Arrows On Chart). Independently of the companion indicators, OkurraButton can draw on the price chart arrows at the historical places where, with the button’s current configuration, a signal would have appeared — and only those that pass the filters of the active button (SAR / MMD / SR / OKUR plus the global filters). You enable them with the Show Arrows On Chart switch, and set the history range in the indicator settings window (the Vis_LookbackDays parameter, default 3 days) — it is not a field on the panel. This is a “replay” of the signal logic on past candles — it lets you assess how densely and in which places the button would react, before it ever touches the EA. Arrows: BUY below the candle (measured from its Low), SELL above the candle (from its High); the arrow’s distance from the candle is set by Chart_Arrow_Offset_Pts (in points). They are drawn from closed candles, so they do not repaint. The whole on-chart visualization is switched on/off by a master switch.
The arrows on the price are filtered, the ones in the oscillator window — raw. The same OKUR event produces an arrow at every raw signal in the oscillator window (all of them), but on the price chart an arrow appears only when the signal passes the filters (usually fewer). The difference between them is exactly what the filters cut off (chapter 6).
This is a design tool, not a prediction. The arrows show where a signal would have appeared according to the oscillator’s geometry and the filters — not where you “should have” entered nor what the market will do next. They serve to calibrate signal density, not to forecast.
Arrow distance (Chart Arrow Offset) — live adjustment. The gap between the arrows and the candles is set by the Chart Arrow Offset (pts) row in the OKUR section — one shared value for all buttons (default 30 points; the rule: SELL = High + offset, BUY = Low − offset). This row behaves differently from the other panel fields: a change takes effect immediately (~1 s), without Apply and without the gold change marker — deliberately, because it is a purely visual correction that you fine-tune “on the fly” while looking at the chart. The value is remembered separately for each instrument and survives an indicator reload and an interval change. It is not part of the strategy: it is not saved to the
.setand does not reach the EA — it is a local display preference.
4.11 Layout: horizontal layout, two columns, scale, dragging
You adapt the panel to your chart with the switch on the title bar and a few settings in the indicator options:
- Horizontal layout — a bar of tabs (from 2.05). A small
H/Vbutton on the right of the title bar switches the layout; the button’s text names the layout you will switch to:H— horizontal,V— back to vertical. In the horizontal layout a bar of twelve narrow tabs appears below the B1–B5 row, one per section; the section code is written letter by letter, vertically:ID,OKUR,POS,SLTP,BETS,SAR,MMD,SR,GFLT,ACT,TSET,TRIG. You click a tab, and below the bar you see only that one section, full width and with its title. The tabs look the same as in the Global panel (chapter 5.4). The panel starts vertical; the chosen layout and tab are remembered separately for each chart — they survive a timeframe change, a parameter change, recompilation, a terminal restart, and also removing the panel from the chart. In the horizontal layout the panel always has one column (the two-column split works only in the vertical one), and the sections have no+/−buttons or “A”. The switch also works on a collapsed panel. Clicking a tab or the switch while a field is being edited cancels that edit — the value goes back to the previous one. - Two columns (disabled by default). When you enable the split, the panel divides into two columns — the sections up to the chosen cut point go into column 1, the rest into column 2. The default cut point is “after Break Even / Trailing Stop” (the engine and management in column 1, the filters and beyond in column 2); the cut point and the column gap can be changed. Useful on wide monitors — you see more at once without scrolling.
- Scale (default 1.0). A size multiplier for the whole panel — 2.0 doubles the size (readability on 4K monitors), values below 1.0 shrink it.
- Position and corner. You place the panel in the top-left or top-right corner, with a pixel offset.
- Dragging. You grab the panel by the title bar and drag it anywhere on the chart; the position is remembered. From 2.05 the panel follows the mouse smoothly, and clicking a button lying on the title bar (
[-],H/V) does not move the panel. - Font (default Consolas). Monospace recommended for even alignment of numbers.
These settings are purely visual — they do not affect the strategy being designed, only how comfortably you work with the panel.
Which layout to choose? The vertical one is good when you want to see several sections at once and scroll. The horizontal one — when you prefer to jump between sections as between tabs and keep the panel low. It is a purely visual preference; it does not affect the settings being designed.
4.12 The typical design cycle for one button
Putting it all together — here is the working rhythm for one strategy in OkurraButton.
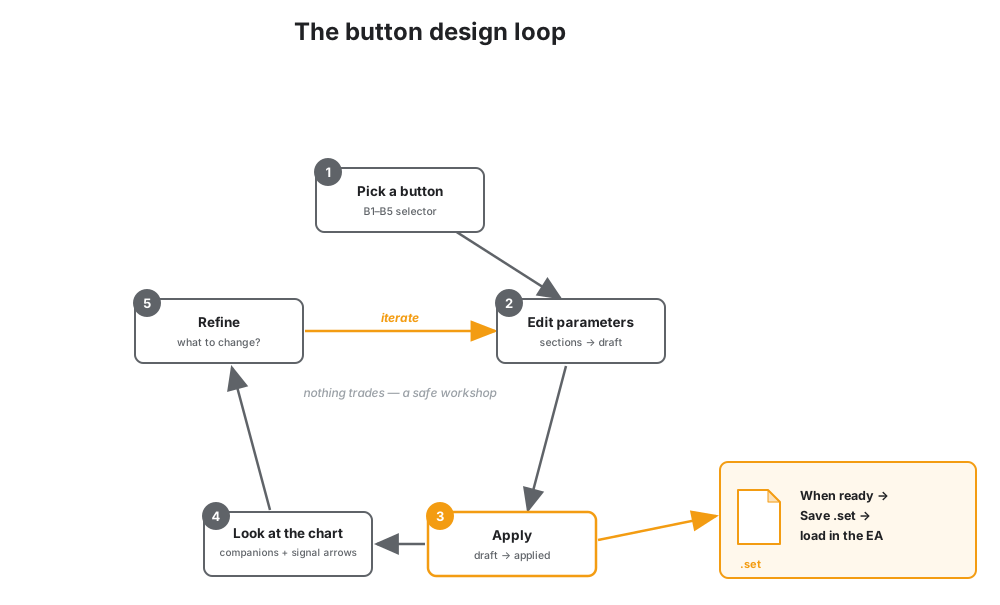
- Drop OkurraButton onto a design chart (without the EA). The companion indicators will pull themselves in (if auto-loading is enabled).
- Select a button in the selector (e.g. B1). If it is a fresh slot, the panel will seed the defaults.
- Edit the parameters in the sections — direction, the OKUR engine, triggers, SL/TP, filters. (What they mean — chapter 9.) The changes go into the draft.
- Apply. The draft becomes applied; the companion indicators and the arrows redraw under the new configuration.
- Look at the chart. Does the oscillator enter the zone where you want it to? Are the signal arrows reasonably dense? Are the filters not blocking everything? Note what to fix.
- Go back to step 3 and iterate until the picture suits you.
- When ready — click Save to save the
.set. From here the configuration goes to the EA (chapter 7) and only there does it start trading.
You repeat this cycle for every button you want to use. You can design the strategies one by one (one session = one button), or clone a good template onto further slots (section 4.9) and differentiate. Patience and watching the companion indicators are the main tool here — this is exactly that “safe workshop” in which a strategy hypothesis becomes visible before it touches the account.
In the next chapter we look at the second design panel — OkurraGlobal — in which you lay out the settings shared by the entire EA: the global filters, the account guardians, Break Even Auto, Stop on Opposite and Trading Hours.