Tool version: O!kurra Capital Defense EA 2.05
This is a practical chapter, not a reference one. Six ready-made configurations to copy on a demo account. Each scenario points back to the chapter that describes the given mechanism in detail — here we focus on assembling the mechanisms into a working whole, not on defining them.
21.1 How to read this chapter
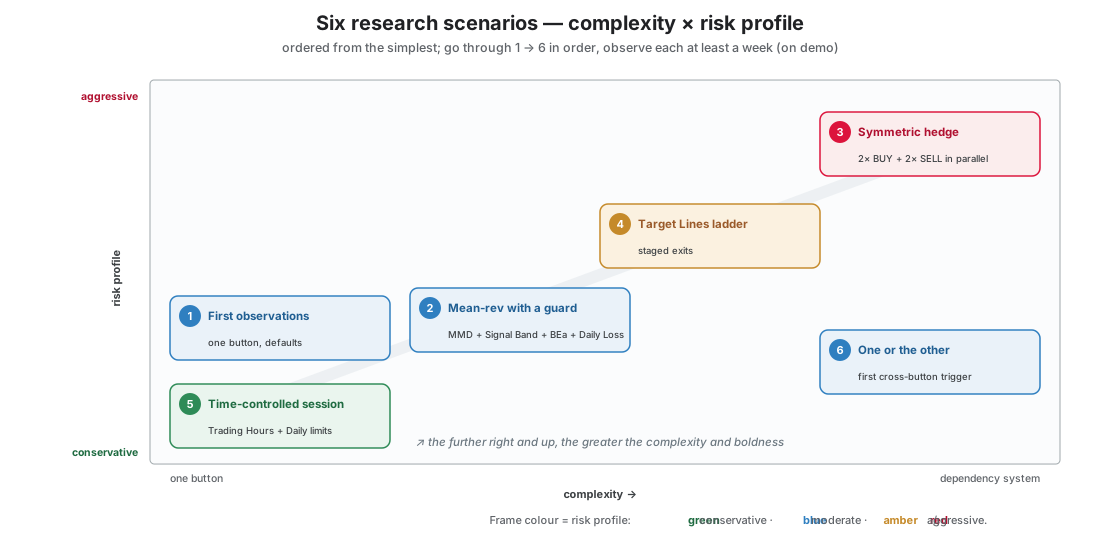
Six research scenarios — complete O!kurra configurations to copy on a demo account. Each has a different profile, a different level of complexity, a different observation goal. They are ordered from the simplest (one button, defaults) to the complex (cross-button trigger), so it is worth going through them in order.
Every scenario has the same structure:
- Idea — the philosophy of the strategy, what we are researching.
- Risk profile — conservative / moderate / aggressive.
- What to set — specific parameter values (as on-screen labels).
- What to click on the panel — the sequence of interactions with the EA panel.
- What to observe — what to watch while it runs.
- When to change the approach — signals that the scenario does not fit the current market.
Four rules before you start:
Demo only. You run every scenario on a demo account. Calibration, stability verification, understanding the behavior — all of that happens on a demo. This is a research and educational tool; you observe how the EA reacts, you are not chasing profit. Whatever you do beyond that is on your side and at your own responsibility.
The values are starting points, not recommendations. The numbers in the scenarios are a starting calibration for XAUUSD (gold) — the most common instrument in O!kurra. Every market has different volatility; for a different instrument or timeframe the calibration is yours. Points (e.g. “Threshold 150”) refer to price points of the given instrument.
Observe for at least a week. A scenario run for two hours will tell you nothing — in two hours you may hit completely atypical conditions. A week is the absolute minimum to start understanding the characteristics. For slower strategies — a month.
Take notes. Every session ends with a note: how many signals, how many profitable, how many losing, what the market conditions were. Without notes, after two weeks you will not remember what worked.
How to read the “What to set” list:
I list only the changes from the defaults. Everything the scenario does not mention stays at its default value — this is an important convention. Parameter names are the labels visible on screen (in the design panel or in the EA’s Inputs), not internal identifiers. A reminder from chapter 2: you design the configuration in the indicators (OkurraButton / OkurraGlobal), save it to a .set file and load it into the EA via F7 → Load (chapter 7). You can also set everything manually in the EA’s Inputs — it works, but without the preview it is tedious.
Button numbering. The EA has five strategies (B1…B5). The factory defaults are mirrored: B1, B3, B5 start as SELL (Threshold +150, Active Side ABOVE), and B2, B4 as BUY (Threshold −150, Active Side BELOW). In the scenarios I always set the direction explicitly, so you do not have to remember “which one was which” — what matters is only that there are five buttons, no more.