
Tool versions: O!kurra Capital Defense EA 2.05 · OkurraButton · OkurraGlobal
Table of Contents
1.1 What the O!kurra ecosystem is 1.2 What O!kurra is not 1.3 Authorship 1.4 Five buttons — five strategies 1.5 The nine-layer architecture 1.6 Two working modes: design and execution 1.7 The “user knows what they are doing” principle 1.8 What we describe, and what remains know-how 1.9 How to read this manual
1.1 What the O!kurra ecosystem is
O!kurra is a set of research and education tools for the MetaTrader 5 platform, designed with fast-moving markets in mind — indices (NAS100, US30, GER40 and related) and commodity instruments (XAUUSD and others). It serves to analyze the behavior of the proprietary OKUR oscillator and to visualize the consequences of trading decisions in the form of trades executed on demo accounts. It is a laboratory for experimenting with strategies — one in which a trader’s hypothesis (“what if, when these conditions are met, we take this position, with this risk”) becomes observable, measurable and repeatable.
The ecosystem consists of three kinds of tools:
Okurra EA (full name: O!kurra Capital Defense) — an Expert Advisor, the heart of the set. A robot that opens, watches over and closes positions according to the rules set by the user, on a single MT5 chart, through a panel placed on that chart (several EA instances can work on one instrument — each on a separate chart). It does this in parallel across five independent lanes — each with its own oscillator, its own thresholds, its own filters and its own way of closing. These five lanes are the Strategy Buttons (B1…B5) — and they are the heart of the tool.
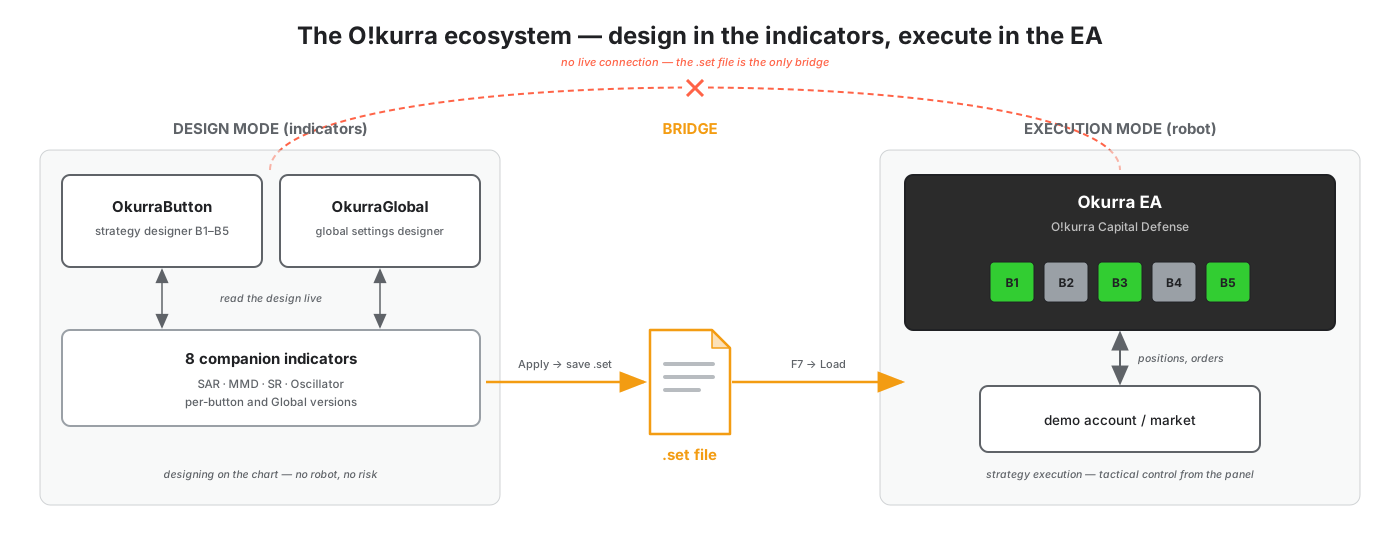
OkurraButton and OkurraGlobal — two designer indicators. They are tools for designing the EA’s configuration directly on the chart, with immediate visual feedback — without running the robot. OkurraButton lets you design each of the five strategies (B1…B5) individually; OkurraGlobal — the shared settings (global filters, account guardians, basket mechanisms). The result of the design work is saved to a .set file, which you then load into the EA in one move. A full description of this architecture — chapter 2.
Companion indicators (visualization) — nine indicators that draw on the chart what the individual filters and oscillators “see”: OkurraSAR, OkurraMMD, OkurraSR and OkurraOscillator (per-button versions), OkurraGlobalSAR, OkurraGlobalMMD, OkurraGlobalSR and OkurraGlobalOscillator (global versions) and — since release 2.03 — OkurraGlobalATR, the volatility-gate window (global version only). They read the configuration designed in OkurraButton/OkurraGlobal and show exactly those MMD clouds, those SAR dots, those SR zones and that OKUR oscillator trace on which the EA will work. You design a strategy — and you see what it sees. Details in chapter 6.
Around the EA’s buttons sits a layer of account-level risk management (Equity Guard, Profit Target, Daily P/L Limits), a layer of basket-closing mechanisms (Break Even Auto, Stop on Opposite, Target Lines) and a layer of geographic and time control (Activation Zones, Trading Hours). Together they form a system in which a single thought — “let’s try to see what would happen if…” — can be designed, saved, launched and observed.
An important point worth realizing from the very first minute of working with the tool: O!kurra makes decisions based solely on price behavior. The robot is not fed by any external data sources — news, the macro calendar, sentiment, fundamental data, analyst opinions. Everything it generates results from how the price of the observed instrument moves, interpreted through the lens of the OKUR oscillator and its associated filters (which also look only at price). If you want to overlay other analytical tools on O!kurra’s decisions — DML, volume profiles, additional indicators on a separate chart, your own observations of macro events — you certainly can, but those layers stand on your side, not on the robot’s side. The robot looks at price, full stop.
A consequence of this design: O!kurra EA is a tool that can open quite a large number of positions during a session. This is not greed or aggression baked into the code — it is the result of five parallel buttons, each with its own oscillator and its own filters, catching nuances of price behavior in many places at once. Each entry is placed in the best spots from the perspective of the specific model of that specific button — and with five buttons configured for different fragments of the market game (mean-reversion, momentum-breakout, momentum-breakdown on different timeframes) the number of potential opportunities multiplies. It is your decision how many of these lanes you activate and at what density — the tool does not hold itself back.
What distinguishes O!kurra from a typical “automated trading system” is the absence of hidden decisions. Everything the robot knows is visible in the parameters. Everything it does is the consequence of rules you entered yourself. The tool has no “self-learning mode”, no “AI magic” and no “intuition of its own”. It has only your configurations and executes them consistently.
1.2 What O!kurra is not
Read this section carefully, because the positioning of the tool is fundamental to how you use it.
O!kurra is not a signal provider for trading on a live account. All scenarios, examples, presets and configurations described in this manual are starting points for observation on a demo account. The decision whether and how to apply observations obtained on demo to trading on a live account remains solely with the user and is made at their full responsibility. The producer supplies an analytical tool supporting the trader’s thought process — it supplies neither signals to execute nor any guarantee of results.
O!kurra is not an investment recommendation system. The parameter values quoted in this manual (Period, Threshold, Movement Correction, Lot Mode, filter defaults) are starting points for testing, not advice. The combination of settings you consider worth deploying after your own tests is your combination — and your risk.
O!kurra does not predict the market. The OKUR oscillator is a descriptive tool: it expresses numerically the state of the market in a chosen time window relative to a chosen reference value. It says “how the market is behaving now, relative to how it behaved over the last N candles”. It does not say what the market will do next. Conclusions about “what comes next” always come from the trader — the tool only supplies numbers for interpretation.
O!kurra is not a ready-made “set and forget”. Each of the five buttons requires configuration, an understanding of its role in the whole, and observation of its behavior on demo. You can launch the EA with default settings, but that does not mean the default settings are optimal for any specific trading scenario — they are merely the initial state from which you begin your research.
This entire section returns in brief in each of the following chapters, in one or two sentences woven into the prose. This repetition is deliberate. What protects you from the pitfalls of misusing the tool is consistently remembering where its competence ends and where your decision begins.
1.3 Authorship
O!kurra was created by two people: Arkadiusz Marek Cyrzan and Mariusz Maciej Drozdowski (MMD). Each brought a different perspective, and the division of roles is tangled enough that it is hard to say “this one did this, that one did that” — concepts blended with implementation in both directions. The main weights can, however, be pointed out.
Arkadiusz Marek Cyrzan — a trader with well over a decade of practical experience, focused on fast-moving markets: indices (NAS100, US30, GER40 and related) and commodity instruments (XAUUSD and others). The conceptual side of the project — the idea for the OKUR oscillator and the way it can be productively used in a trading robot, as well as the concept of independent strategy buttons (five in the current release) as a way to fit many strategies into a single tool — is his contribution. Arkadiusz Marek Cyrzan is responsible for how the tool is meant to think about the market.
Mariusz Maciej Drozdowski (MMD) — a trader, author of the MMD methodology and originator of specific solutions in O!kurra: the Break Even Auto (BEa) mechanism with its five types of Auto-Arm Triggers and the concept of linking buttons into logical chains (one button can activate or deactivate others, forming whole strategic sequences). He is also responsible for the implementation side — the code, the architecture, single-tick performance optimization, and the integration of the engine’s layers.
Some solutions in O!kurra are shared concepts, arrived at over hundreds of hours of conversations and tests — the boundary cannot be drawn cleanly and there is no point stretching it.
The MMD methodology is the broader background in which O!kurra resides. The full ecosystem of tools related to the MMD methodology — the MMD Cloud, MMD CP, MMD Diamond indicators and others, education, market analyses — is available at magiconcharts.com. For the O!kurra set itself and its related tools, head to okurra.com.
More about the authors: under the names Arkadiusz Marek Cyrzan and Mariusz Maciej Drozdowski in a search engine, on the MagicOnCharts channels on social networks (a YouTube channel run by MMD since 2016), and in other industry publications. The MMD methodology was nominated for the Product of the Year award at the Invest Cuffs congress, and a year later Mariusz Maciej Drozdowski received — also at Invest Cuffs — a nomination for the title of Personality of the Year.
1.4 Five buttons — five strategies
The most important architectural decision of O!kurra EA: there is no single global “strategy” with parameters. There are five parallel, fully independent decision units, called buttons (Strategy Buttons, labeled B1 through B5). (Until release 1.28 there were seven — B6 and B7 were retired in release 2.00, because practice showed that real strategies use three to four lanes; the reclaimed space went to new mechanisms. Migration from older configurations — chapter 3.)
Each button is an autonomous unit, possessing its own:
- position direction (BUY or SELL — decided at configuration time),
- OKUR oscillator (Period, Sensitivity, Timeframe — independent of the other buttons),
- signal threshold (Threshold — a value on the oscillator axis),
- active side (Active Side — whether we observe the market above or below the threshold),
- triggering mechanism (Movement Correction or Movement Continuation, or both),
- signal validity band (Signal Validity Band — extending the signal’s validity past the zone’s threshold, towards the oscillator’s return; from 2.05 the zone’s restriction is its far edge, Zone Reach),
- pending order distances (Pending Stop Distance, Pending Limit Distance),
- position size and lot mode (Fixed or Per Balance),
- Stop Loss and Take Profit,
- position management mechanisms (Break Even, Trailing Stop),
- directional filters: three of its own (SAR, MMD Clouds, SR Box — local versions, each with the option of switching to the global version) plus an opt-in to the fourth, global-only OKUR Filter (the zone model — chapter 10.6),
- activation zones and BEa interaction (Activation Zones, Follow BEa, Stop on Target Hit),
- opposite-signal reaction logic (Stop on Opposite — from four sources, with a choice of: disabling the button, closing its positions and disabling it, or closing the positions while keeping the button active).
In practice this means that on one chart you can run five different approaches to the same market. Example configurations that show this flexibility:
Example — the multi-layer player. Button B1: BUY on M1 with a deep Threshold = -150, Movement Correction = 5 (mean-reversion from an extreme bottom). Button B2: BUY on M5 with a more moderate Threshold = -80, Movement Correction = 10 (a second BUY lane, less aggressive, on a different timeframe). Button B3: SELL on M15 with Threshold = +120, Movement Continuation = 20 (SELL momentum-breakdown, rare signals, larger SL). Buttons B4-B5: disabled, waiting for an idea.
Example — the symmetric hedger. B1 and B2: SELL on M1 with different parameters and different filters (one more restrictive, the other looser). B3 and B4: BUY symmetrically. The rest disabled. The strategy: any strong move in one direction will be caught by one of the pairs; the opposite positions will be closed by BEa at the weighted breakeven of each direction.
Example — the single-shot researcher. B1: one configuration, e.g. BUY M1, OKUR Period = 8, Threshold = -130, Movement Correction = 8, lot Fixed 0.01, SL and TP at 200 points each. The remaining buttons disabled. The goal: clean observation of how this specific engine behaves through a session, without interference from other strategies.
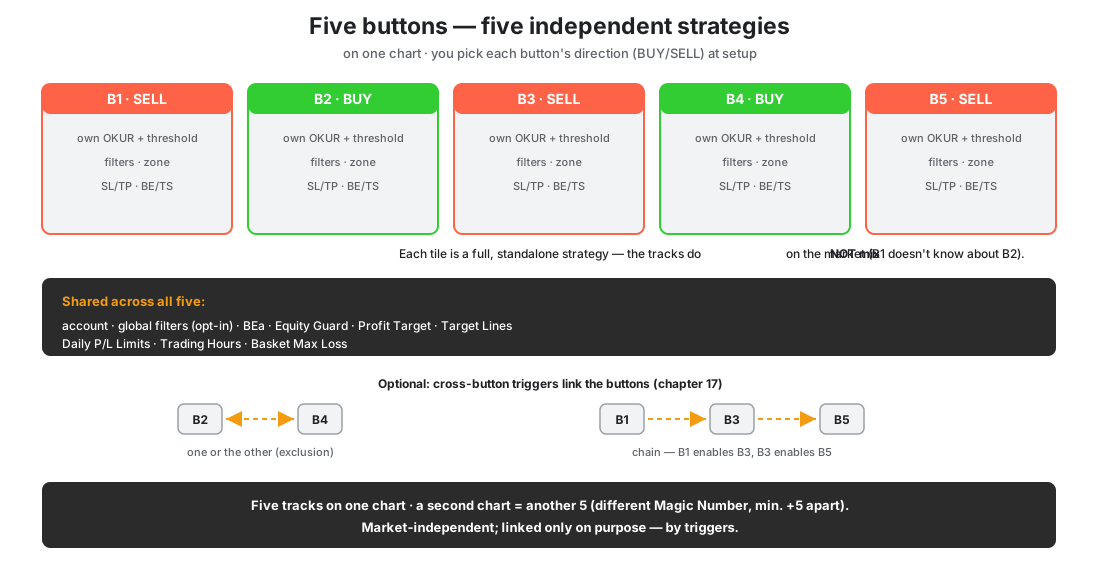
What the buttons do among themselves market-wise never mixes. B1 knows nothing about B2. B3 does not block B5. Each has its own Magic number (computed from the global Magic Number plus the button index), its own position history, its own oscillator extremum memory. Two buttons can generate positions in opposite directions on the same tick — and both positions will be created. Hedging is allowed, parallelism is natural.
Five is the limit per chart (per EA instance). Need more lanes? Launch the EA on a second chart — it can even be the same instrument — just remembering to use a different Magic Number (chapter 9). That is why we say “five strategies per chart”, not “per instrument”.
Buttons can, however, influence one another — through the cross-button triggers mechanism (logical chains). Each button can be configured so that a change of its state (manual enable, manual disable, automatic enable by the EA, automatic disable by the EA) triggers an action (enabling or disabling) on another button of the five. This allows building complex scenarios — mutual activations, deactivation chains after a basket realization, “one or the other” pairs (mutual exclusion — two arbitrarily chosen buttons configured so that enabling one automatically disables the other — this is an effect of your trigger configuration; no button has such behavior permanently built in) and other strategic configurations. The mechanism is optional, default = NONE = no connections, but once you activate it, the five buttons become a system of dependencies, not a set of independent lanes. See chapter 17.
What all the buttons do have in common is:
- a shared account (obviously),
- optional global filters (each button may enable “Use Global SAR Filter”, “Use Global MMD Filter” etc. — it then uses the shared global set instead of the local filter parameters),
- shared supra-position mechanisms (Equity Guard, Profit Target, BEa, Target Lines, Activation Zones — all operating at the level of the basket of a given direction, regardless of which button generated which position),
- shared safety and time frames (Daily P/L Limits resetting at a fixed calendar hour, Trading Hours defining when the EA works at all — see chapters 14 and 16).
Five buttons is a hard limit, deliberately chosen. It leaves room for a real multi-layer approach, but not for chaos.
1.5 The nine-layer architecture
Look at O!kurra EA as nine decision layers, each with its own responsibility. The lower the layer, the closer it is to a single price move and a specific entry signal; the higher — the more its decisions concern the whole: the basket of positions, the account state, the time frames of the session. Layer 1 answers the question “is this the moment to enter”, layer 7 — “shouldn’t this trading day already be over”.
Layer 1 — Strategy Buttons. Five independent strategy engines. They generate signals based on their own OKUR oscillator configurations and triggers. See chapter 9.
Layer 2 — Signal filters. After a button generates a signal, but before it is executed on the market, the signal must pass through the directional filters. There are four of them: SAR, MMD Clouds and SR Box exist per button (local versions) with the option of switching to the global versions (one set for the whole EA, shared among the buttons that choose to plug into it), while the fourth — the OKUR Filter (a second OKUR engine, typically on a higher timeframe; the zone model) — exists globally only (chapter 10.6). The filters are independent for each button — B1 may require a bullish MMD Cloud, B2 may work without the MMD filter but with SAR active. See chapter 10.
Layer 3 — Activation Zones and Target Lines. Geographic control of button behavior: zone rectangles on the chart (a button is active only when the price is inside the zone) and horizontal target lines (basket closure on touch). Chart activators, both controlled with a single click on the panel. See chapter 11.
Layer 4 — Position management. Each open position can be watched over by Break Even (moving the SL to a profit threshold after a defined move) and Trailing Stop (an SL following the price at a fixed distance). Both mechanisms are per button and can be enabled independently for each. See chapter 9.
Layer 5 — Break Even Auto (BEa). Above individual positions operates BEa — a mechanism that computes the weighted average break-even of all positions of one direction, adds a profit margin in points (BEa Gain), and closes the entire basket when the price reaches that level. In hedge mode (BEa Hedge Mode) the BEa basket can encompass positions of both directions at once — the break-even is then computed from their resultant (net), and the realization closes all positions of both directions simultaneously. BEa can be armed manually or automatically — from five trigger types (Time, SAR flip, MMD cross, SR break, OKUR transition); additionally, buttons can join the game themselves when BEa becomes armed (Follow BEa). See chapter 12.
Layer 6 — Stop on Opposite. Separately from the entry filters operate four filters reacting to a reversal of context. When SAR / MMD / SR / OKUR show a signal opposite to the button’s direction, the button can (optionally, per button, per filter) react in one of three ways: disable itself (it stops generating new signals, existing positions live on), close its positions and disable itself (closing the button’s positions, canceling its pending orders and disabling it), or close the positions while staying active (positions closed, but the button keeps generating signals — useful when the opposite signal is meant to clear exposure, not switch off the strategy). The closing filters have their own, separate parameters — you can have a restrictive entry filter (rare but confident signals) and an aggressive closing filter (reacting quickly to a change of context). See chapter 13.
Layer 7 — Account guardians. Four independent mechanisms operating at the level of total PnL and capital safety. Daily P/L Limits (DPL) shut down trading after a defined daily loss or profit is reached — a cyclical mechanism, resetting at a fixed calendar hour. Equity Guard (EG) watches the profit side: it closes everything after a profit threshold is reached (with a trailing option — locking in accumulating profit). The basket loss side is watched by Basket Max Loss — a safety net closing the basket after the planned loss is exceeded, after which the game continues. Profit Target (PT) closes everything when realized profit reaches the target (with the option “losing only, we keep the profitable ones”). See chapters 14 and 15.
Layer 8 — Trading session (Trading Hours). The definition of time windows in which the EA may operate at all — per day of the week, with the possibility of multiple windows per day (e.g. “trade from 8:00 to 12:00 and then from 14:00 to 22:00”). Outside the defined hours all buttons remain inactive, regardless of the other layers. See chapter 16.
Layer 9 — Cross-button Triggers (logical chains). The highest layer allows buttons to influence one another: to activate, deactivate, form chains of dependencies. Each button can, in response to a change of its own state (manual enable, manual disable, automatic enable by the EA, automatic disable by the EA), perform an action on another button of the five. This allows building complex scenarios — “if B1 enters the game, enable helpers B3 and B5”, “if B5 reaches its Target Line and disables itself, disable B3 and B4 too, because their context is over”, “I bind any pair of buttons into mutual exclusion — enabling one disables the other, so at any given moment only one of the pair plays”. See chapter 17.
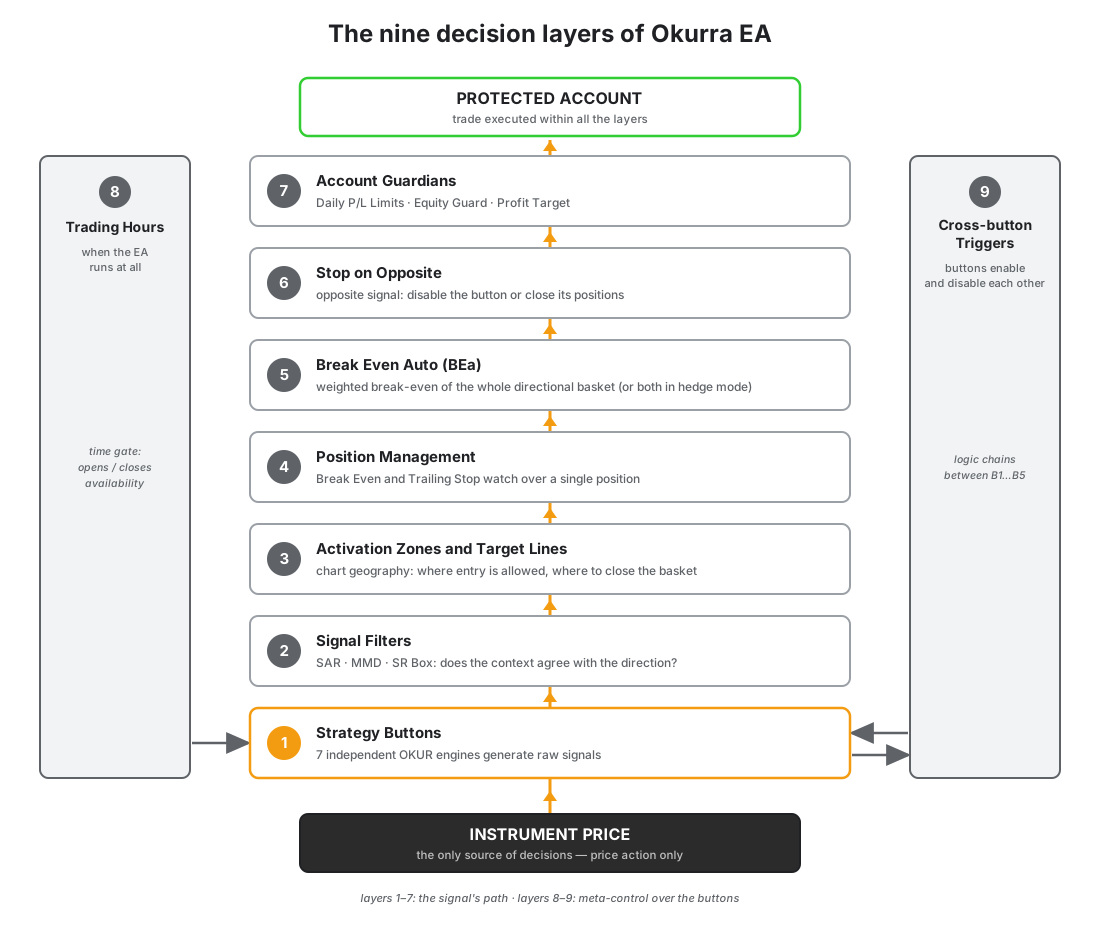
The signal travels bottom-up through the layers: the trading session (8) decides whether the EA is working at all right now, the button (1) generates the raw signal, the filters (2) decide whether to let it through, the chart geography (3) decides whether the button operates at all in the current zone, the position mechanisms (4) take care of the open trade, BEa (5) manages the direction’s basket, Stop on Opposite (6) reacts to a change of context, the account guardians (7) protect the whole, and the logical chains (9) control the mutual enabling and disabling of buttons. Layers 1-7 are directional (the signal flows through them); layers 8 and 9 are more like meta-layers — they operate on layer 1, controlling its availability and the connections between buttons.
In each of these layers you can leave the defaults or influence the behavior. It is a gradient — from “enable a button and observe” to “configure everything your own way, build a complex system of dependencies”.
1.6 Two working modes: design and execution
The O!kurra ecosystem separates two activities that in typical EAs are glued into one: designing the configuration and executing the trading.
Design mode is working with the OkurraButton and OkurraGlobal indicators (plus the companion indicators). On the chart — without a running robot — you lay out the parameters of each strategy, watch live how the filters and the oscillator look with those parameters, and iterate at will. Nothing trades, you risk nothing, no position is created. You save the result of the work to a .set file.
Execution mode is working with the EA. You load the designed .set file into the EA’s configuration window (F7 key → Load), the robot starts with the complete configuration and executes it on the account. While it works, you steer it tactically from the panel (enable/disable buttons, zones, BEa, limits), but the strategic shape of the configuration comes from the design phase.
These two modes are deliberately separated — the indicators do not steer a running robot “live” and there is no real-time connection between them. The only bridge is the .set file. Why it is so — and what follows from it in practice — is explained in detail in chapter 2. Here it is enough to remember one sentence: you design in the indicators, you execute in the EA, you transfer with the .set file.
1.7 The “user knows what they are doing” principle
O!kurra does not validate the “sensibleness” of your parameter combinations. Consistently. If you configure a BUY button with Threshold = +150 and Active Side = ABOVE (meaning it will buy at OKUR highs), the tool will not block it. It may warn in the log, it may not — but it will certainly not say “I won’t allow it, because it makes no sense”. Because from the engine’s perspective it is not senseless; it is simply a different strategy: buying on momentum-breakouts, when the oscillator shows a strong upward move.
The same freedom applies to other “suspicious” configurations: setting Movement Correction and Movement Continuation at the same time (the button reacts to the first condition met; this can be used deliberately); a Threshold = 0 (entry on every crossing of the zero axis, a hyper-active scalping mode); Pending Stop Distance = 0 and Pending Limit Distance = 0 (the button enters immediately on the signal, without waiting for confirmation by a price move).
The philosophy is that the tool lets you be smarter than if it tried to protect you from yourself. The price of this freedom: if you configure something that works differently than you thought, the tool does not warn you — it executes the configuration you entered. Hence the importance of observation on demo. Hence the importance of calibrating parameters step by step, button by button, instead of immediately launching the whole five from a setup you have not looked at. And hence the value of design mode — the OkurraButton/OkurraGlobal indicators let you see the consequences of a configuration before the robot starts executing it.
When later in this manual you see examples of specific parameter values (e.g. “Threshold = -150, Movement Correction = 5”), treat them as starting points for observation. Not as recommendations. Every market breathes differently, every timeframe has a different tempo, every strategy requires calibration to the specific instrument and the specific moment in time in which you use it.
1.8 What we describe, and what remains know-how
The manual you are reading describes the behavior of the tools: what each parameter does, how to interpret values, how to calibrate settings, when to use them and when not to. In other words — everything you need to work effectively with the O!kurra set.
Some things in O!kurra we describe fully, some — functionally, referring the interested reader to a separate source, and some — we leave as proprietary know-how. It is good for you to know where these boundaries run.
What we describe fully and without reservations:
- The workings of the SAR filter — it is the standard Parabolic SAR, available on every trading platform, with documentation in hundreds of places on the web. There is nothing to hide here.
- The workings of the SR Box filter — it is standard support-and-resistance zone mechanics with a base construction on ZigZag. A classic.
- All configuration parameters of every mechanism — Threshold, Period, Sensitivity, distances, multipliers, opt-in options. Exactly what each one does, how to set it, what effect it has.
- The logic of all layers — when a signal is generated, when filtered, when executed, when closed.
What we describe functionally, referring to a separate source:
- The MMD Clouds filter — it is the proprietary MMD methodology, but it is publicly documented and available. The full ecosystem of MMD methodology tools (MMD Cloud, MMD CP, MMD Diamond, statistics) together with educational materials can be found at magiconcharts.com. In this manual we describe MMD Clouds functionally — what it indicates, how to read its signals, how to use it as a filter in O!kurra — without repeating the methodology’s full documentation. If you want to dive deeper into how MMD Clouds are formed and what exactly they signal, the road leads through magiconcharts.com.
What remains proprietary know-how:
- The exact way the value of the OKUR oscillator is computed — it is Arkadiusz Marek Cyrzan’s proprietary concept, the foundation of the entire tool.
- The exact formula for the weighted breakeven in the BEa mechanism — MMD’s proprietary construction.
- Internal thresholds and tolerance constants inside individual mechanisms, if such exist.
This distinction is not a legal defense or an attempt to hide something difficult. It is philosophical — and very simple.
Think of O!kurra as a craftsman’s work. A carpenter shows you how to open the wardrobe, how to close it, how to oil the hinges, how to clean the finish, in what conditions the wood is best kept, when not to use it in a wet kitchen. Everything that makes the wardrobe useful in your home is disclosed to you. What the carpenter will not do — is invite you into his workshop and show you in what order he joins the side boards, what glue he uses, how he dries the fronts, how many days the construction rests before lacquering. That is his recipe. That is the reason this wardrobe exists, and not another. The recipe stays with the craftsman.
The same with O!kurra. Everything you need in order to use it — you have in the manual, fully, without restrictions, in every detail of behavior. How some fragments of the engine work inside — is part of what makes the tool a tool, and not another oscillator like the others. It stays with the authors.
How this looks in practice for you:
You ask the manual or the chatbot “how do I set Threshold for scalping on M1?” — you get a full answer. “What does an OKUR value of -180 mean?” — you get a full answer. “Why does my button generate no signals?” — you get a full answer with a checklist of things to verify. “How does MMD Cloud work?” — you get a functional answer plus a pointer to magiconcharts.com, where you can go deeper.
You ask “how exactly is the OKUR value computed?” or “what is the formula for the weighted breakeven in BEa?” — you get a calm answer that this is part of the proprietary know-how of Arkadiusz Marek Cyrzan and MMD and remains what it remains. Plus, if you keep asking and press harder, the same answer in its final version — without excuses, without anger. This is where we agree the boundary ends.
As MMD himself likes to say: the answer is very simple — as in life, you just have to hit upon it. That sentence is the only hint you will get on this matter. It is also completely sincere — because true answers in trading are usually simple. They are just not usually obvious. That is a difference the market does not forgive and which is the foundation of every craft.
In return you get something you rarely get in this industry: fully documented tool behavior, in which you invest your time and test capital. You know how every parameter works, how to choose it, how to interpret it, how to calibrate it. You know when the tool makes sense and when it does not. You know where its competence ends and where your decision begins. That is the manual. That is what you get. The rest — is the recipe.
Practical tip — the chatbot at okurra.com.
The manual you are reading is several dozen pages long and is designed for a linear read-through or for precise, technical reference. You do not always have time for that, though — especially when you are looking for a quick answer to a specific question while working with the tool.
At okurra.com an O!kurra chatbot is available which knows the contents of this manual and answers questions related to the tools, their configuration, the methodology and the approach to the market. It works in many languages — you ask in yours, you get the answer in yours. Often faster than leafing through the manual, especially when you cannot remember in which chapter exactly the answer to what interests you was. Everything we wrote in the manual — the chatbot knows. Everything that constitutes know-how — the chatbot keeps just as the manual does.
1.9 How to read this manual
Chapters 1 through 23 are largely independent and can be read in any order — but there is an order that makes sense if you want to get from “what is this at all” to “I can design and launch my own strategy”.
First opening (60 minutes):
- Read the rest of this chapter (if you have not finished it already).
- Chapter 2 — the two-mode architecture: design vs execution, the
.setfile as the bridge. This is the foundation for understanding the whole set. - Chapter 3 — installation, first launch, license verification at okurra.com.
- Chapter 8 — the anatomy of the EA panel, what you will see on the chart.
- Chapter 9, but only the first sections (the OKUR engine and triggers — the concept of the signal).
After that time you will know what the set is, how to launch it, what you see on the chart after launch, and how the signal is generated. Enough to launch one button on a demo account and observe.
Designing strategies in the indicators (2-3 hours, spread over time):
- Chapter 4 — OkurraButton, the designer of strategies B1…B5.
- Chapter 5 — OkurraGlobal, the designer of global settings.
- Chapter 6 — companion indicators: how to see on the chart what the filters see.
- Chapter 7 — saving the configuration to
.setand transferring it to the EA.
You can also skip this block at first and come back to it later — the EA can be configured directly in its Inputs window, without the indicators. But working with the indicators is more convenient and safer, because you design with visual control and without a running robot.
Full tour of the EA engine (3-4 hours, spread over time):
- Chapter 9 to the end — all button parameters.
- Chapter 10 — global filters (if you intend to use them).
- Chapter 11 — Activation Zones and Target Lines (when you want to control where a button may operate and where to close the basket).
- Chapters 12 and 13 — Break Even Auto and Stop on Opposite. These are the protective layers for positions and the basket.
Account guardians and session frames (1-2 hours):
- Chapter 14 — Daily P/L Limits (daily profit and loss frames with resets).
- Chapter 15 — Equity Guard and Profit Target (direct limits, not cyclical).
- Chapter 16 — Trading Hours (when the EA works at all).
These three chapters together give you the complete toolkit for managing risk at the account and session level. You can read them in any order — each mechanism is independent of the others. The default of all these layers is disabled — so until you configure them, the EA works “forever, to any amount”.
Logical chains (1 hour, but only when ready for this level):
- Chapter 17 — Cross-button Triggers. The most advanced layer of the tool, MMD’s original concept. You link the five buttons into sequences in which one influences another. Read it only when you know chapters 1-16 well and have a specific vision of a strategy that needs it. Do not read it “out of curiosity” — without prior experience it can be overwhelming.
Entries outside the oscillator (1 hour):
- Chapter 18 — Price Movement: price-travel sensors. A position opens once price covers a set distance — without waiting for the oscillator.
- Chapter 19 — Time Setups: entries at an appointed minute. The clock opens the opportunity, price decides whether it is taken.
Practice (open-ended time):
- Chapter 20 — trade visualization (T. Levels, T. History) and controlling the companion indicators from the EA.
- Chapter 21 — research scenarios. Instead of reading linearly, open the one that most resembles what you want to investigate. Copy the parameters, launch on demo, observe.
- Chapters 22 and 23 — Troubleshooting and FAQ. You come back here when something does not work or when you have a specific question.
- Chapter 24 — the glossary. You open it while reading the other chapters, whenever you stumble over a term you do not recognize.
What you will see in each chapter:
At the beginning of each chapter there is a table of contents of its sections with links to the individual subsections. Each section starts with a short introduction saying what it is about, then comes the content, and at the end — where it makes sense — a short summary and pointers to other chapters in which the topic is developed further.
Parameter names are quoted exactly as you see them on the settings screen (the Inputs tab in MT5 or the indicator panel) — e.g. Active Side, Movement Correction, Use Global MMD Filter, Stop button after Target Line hit, Daily Profit Limit. Values in the examples (e.g. Threshold = -150) are starting points, not recommendations — calibration to your market and your risk tolerance is your responsibility.
Spotted a discrepancy? Let us know. Our tools and infrastructure evolve dynamically — this is not a closed ecosystem — so despite our efforts, minor discrepancies may (though should not) appear between the manual, the chatbot’s answers and how the EA actually behaves. If you notice such an inconsistency, please report it to [email protected] — it helps us keep the manual as up to date as possible.
In the next chapter we take apart the two-mode architecture — why design and execution are separated, how exactly the .set bridge works, and what follows from it for your daily workflow.