
Move geometry: correction versus continuation
Two buttons in the same direction, differing only in the geometry of the entry — one buys the panic at its climax, the other waits for evidence of reversal. See on a single chart how differently they enter the same move.
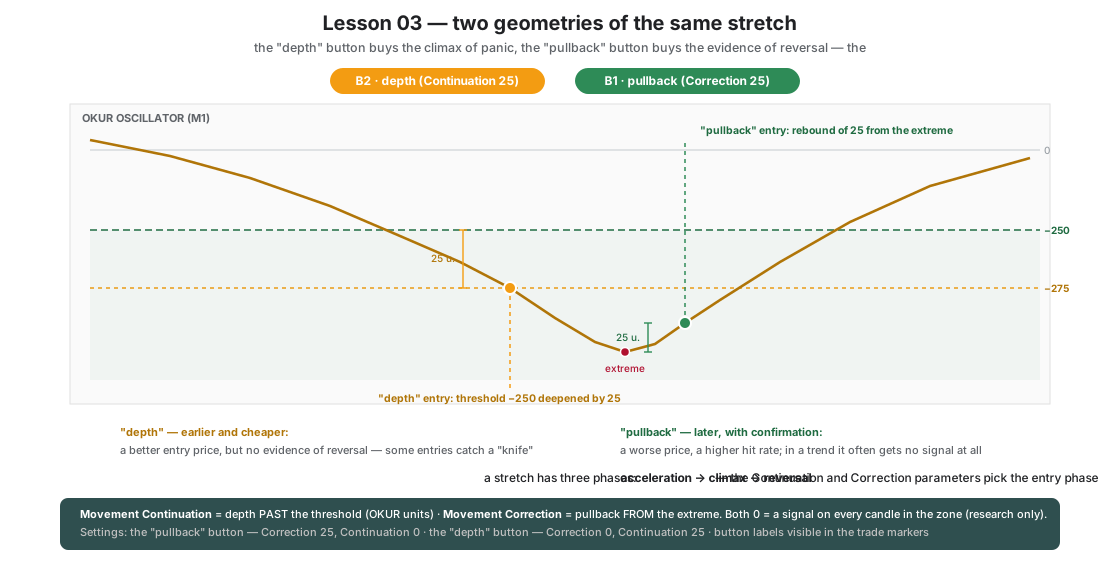
In lessons 01–02 the signal fired after a rebound of 5 units off the oscillator’s extreme. Those 5 units are one of the two move-geometry parameters that decide WHICH moment of the stretch we treat as the entry:
- Movement Correction — “wait for the pullback”. The signal fires when OKUR rebounds off its extreme by a set number of units. The larger the value, the stronger the evidence of reversal we demand.
- Movement Continuation — “wait for the deepening”. The signal fires when OKUR pushes into the zone DEEPER than the threshold by a set amount. We do not wait for a rebound — we buy the panic at its climax, cheaper.
This set runs two buttons at once, in the same direction, differing only in geometry — so that on one chart you can see how differently these two philosophies enter the same move.
What is switched on, and why
| Button | Setting | Philosophy |
|---|---|---|
| B1 “pullback” | Movement_Correction=25, Continuation=0 | entry only after a clear (25-unit) rebound off the extreme — later, but with confirmation |
| B2 “depth” | Correction=0, Continuation=25 | entry when the stretch deepens by 25 units past the threshold — earlier and cheaper, but without evidence of reversal |
| Both | threshold ±250, SL 200, TP 800, BE 200/100, TS 300/100, max 2 positions | identical frames — the geometry of the entry is the only difference |
The button labels (B1_Label, B2_Label) are visible in the trade markers, so on the chart you immediately see which philosophy opened which position.
How it makes price behavior visible
Every overstretched excursion has three phases: acceleration → climax → reversal. The two buttons highlight them live:
- The “depth” button enters in the climax phase — its markers appear deeper, at a better price, but some of them catch a “knife” that deepens further (the SL works more often).
- The “pullback” button enters in the reversal phase — after a rebound of 25 units. The entry price is worse, but the hit rate is clearly higher.
- In moves that actually reverse, both buttons hold a position — “depth” at a better price. In moves that keep trending, “depth” collects losses while “pullback” often gets no signal at all (OKUR does not rebound by 25) — the geometry alone already acts as a filter.
After a week of watching, you understand the sentence at the core of all of Okurra: there is no single “good” entry — there is an entry matched to the phase of the move, and the Correction/Continuation parameters let you pick that phase.
What to watch on the chart
- Pairs of “depth” vs “pullback” markers within the same stretch — the difference in entry price is the cost/value of confirmation.
- Stretches where “pullback” stays silent while “depth” loses — this is the lesson in why the 0/0 value (a signal on every candle inside the zone) is reserved strictly for research.
Next step
Lesson 04: since many signals can fire inside one zone, we need discipline — a signal validity window and position-density limits.
B1_Movement_CorrectionB1_Movement_ContinuationB2_Movement_CorrectionB2_Movement_ContinuationB1_LabelB2_Label
Load these in MetaTrader 5 via F7 → Load to reproduce the lesson exactly. Since release 2.04 the lesson sets switch the robot on when loaded (an orange “Trading ON from .set” bar shows under the panel title); if you switched the robot off with OFF during an earlier lesson, click ON in the panel's top row — the next set does not undo your click. Available to signed-in users with an active licence.
Educational material, not investment advice. The sets are teaching examples — before any live use, test on real ticks and tune to your own account. Reference deposit 1000 in account currency, lot 0.01; scale money values proportionally to your balance.