
First signal: price stretches, then returns
The simplest configuration Okurra EA allows — one button, one position, a hard SL and TP. See where the entry signal actually comes from, before we add filters and shields.
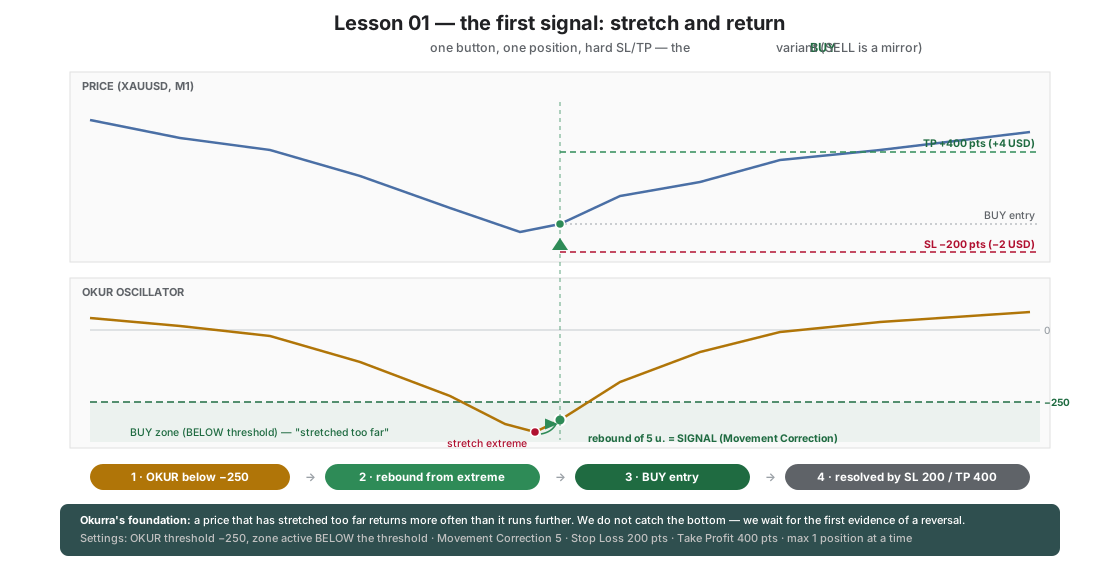
This is the simplest configuration Okurra EA allows: one button, one position at a time, a hard Stop Loss and Take Profit — and nothing else. Before we add filters, shields and capital protection, we want to see the bare foundation: where the entry signal actually comes from.
At the heart of Okurra sits the OKUR oscillator — a measure of how far price has stretched from its local average (the CCI family, computed from the typical price). When the market overdoes it in one direction, OKUR runs far from zero. This lesson shows the fundamental observation the whole tool is built on: price that has stretched too far returns more often, statistically, than it runs further.
What is switched on, and why
| Feature | Value in the set | Role in this lesson |
|---|---|---|
Button B1 (B1_InitialEnabled=true) | BUY main / SELL main | the only active button |
OKUR threshold (B1_Threshold, B1_Zone) | BUY: −250, zone BELOW · SELL: +250, zone ABOVE | the definition of “stretched too far” (oversold / overbought); a deep threshold, because we have no filters yet — we only react to genuinely strong excesses |
Movement Correction (B1_Movement_Correction=5) | 5 (factory default) | the signal fires only once OKUR rebounds 5 units off its extreme — we don’t catch a falling knife |
Position limit (B1_MaxPositionsPerButton=1) | 1 | one position at a time — every trade is its own readable story |
Stop Loss / Take Profit (B1_StopLoss=200, B1_TakeProfit=400) | 200 pts = 2 USD · 400 pts = 4 USD | hard boundaries: risk 1 : reward 2 |
Trade markers (Global_ShowTradeMarkers=true) | on | every entry and exit visible on the chart |
Oscillator display (B1_ShowOscillator=true) | on | we are learning to READ the signal, not just trust it |
Every other mechanism (filters, BEa, Equity Guard, schedule) is off — this is the reference point for the entire course.
What it reveals about price
- The stretch. XAUUSD on M1 can travel several hundred points in a handful of candles. OKUR shows this as a dive below −250 (the BUY variant) — the market has pushed too hard.
- The rebound. We do not enter at the very bottom of the stretch. Movement Correction = 5 waits until the oscillator pulls back 5 units off its extreme — the first evidence that supply is weakening. Only then does the signal fire and the arrow appear.
- The resolution. The position lives between the SL (−200 pts) and the TP (+400 pts). Nothing rescues it, nothing is added to it. After a few days of watching, the chart leaves you a map: where the return to the mean works, and where the market trends and the stretch simply never comes back — the frustration that the following lessons exist to fix.
Before you start: switch the robot on
After loading the set via F7 → Load, click ON in the top row of the EA panel. As of release 2.00 Okurra starts switched off by default: the button is red and the panel title reads “O!kurra - EA OFF”. That is a deliberate safeguard — dropping the robot onto a chart starts nothing until you consciously decide it should.
If nothing happens after you load the set, this is the first thing to check — not a configuration fault. This lesson’s button B1 is enabled from the start (B1_InitialEnabled=true), but the EA master switch sits above it and wins.
What to watch on the chart
- The signal arrows in the oscillator window and on the chart — in this lesson they match 1:1, because there are no filters at all (an important reference point before lesson 5).
- The trade markers: entry, the SL/TP levels, the outcome.
- The moments when a BUY signal appears inside a falling trend — remember them; we come back to them with the MMD filter.
- The bare ±250 signal enters the market dozens of times a day and pays the spread on every one of those entries — the first cost that the later layers work to contain.
Next step
Lesson 02: the same trade, but the exit stops being rigid — the position secures its own entry (Break Even) and follows the move (Trailing Stop).
B1_ThresholdB1_ZoneB1_Movement_CorrectionB1_MaxPositionsPerButtonB1_StopLossB1_TakeProfit
Load these in MetaTrader 5 via F7 → Load to reproduce the lesson exactly. Since release 2.04 the lesson sets switch the robot on when loaded (an orange “Trading ON from .set” bar shows under the panel title); if you switched the robot off with OFF during an earlier lesson, click ON in the panel's top row — the next set does not undo your click. Available to signed-in users with an active licence.
Educational material, not investment advice. The sets are teaching examples — before any live use, test on real ticks and tune to your own account. Reference deposit 1000 in account currency, lot 0.01; scale money values proportionally to your balance.